Matplotlib Syntax Error: How to Solve the Issue
Updated on
Python's matplotlib library is a powerful tool for creating beautiful and expressive visualizations. However, as with any programming library, errors are bound to occur - SyntaxError being a common one. This article aims to help you understand, diagnose, and resolve these issues, with a special focus on introducing an alternative tool named PyGWalker to simplify your data visualization tasks.
Understanding Syntax Errors in Python
Before diving into matplotlib, it's crucial to have a basic understanding of what a syntax error in Python means. Syntax errors, as the name suggests, occur when the Python parser fails to understand a piece of code. In essence, your code has violated the rules of Python's language syntax. Typical causes include incorrect indentation, mismatched brackets, missing colons, incorrect variable names, among others.
Matplotlib Syntax Errors: Common Causes and Fixes
In the context of matplotlib, syntax errors can occur for several reasons. They could be due to incorrect usage of the library's functions, mismatched parentheses, misspelled function or method names, wrong parameter values, or incorrect data types.
Resolving these errors largely involves debugging your code. Python's traceback error messages are helpful for this. They point you to the line of code causing the error, and provide a description of the issue. A keen understanding of matplotlib's syntax and your code logic can expedite the debugging process.
An Example Scenario
Let's consider an example scenario where a syntax error might occur when using matplotlib:
import matplotlib.pyplot as plt plt.plot([1, 2, 3, 4]
The code above would raise a SyntaxError due to the missing closing parenthesis. To resolve this, we simply add the parenthesis:
import matplotlib.pyplot as plt
plt.plot([1, 2, 3, 4])
Fix Matplotlib "invalid syntax %matplotlib inline" Error
When trying to use the code %matplotlib inline in a Python script, you may encounter an error - "invalid syntax". This error occurs because % is not a valid Python syntax, and %matplotlib inline is a magic command that only works with Jupyter notebooks or IPython terminals.
The %matplotlib inline command enables the visualization of graphs and plots within the notebook interface itself and is a convenient way to generate and display plots when using Jupyter notebooks. However, the %matplotlib inline command is not applicable in scripts that are designed to be executed outside the IPython environment, including standard Python scripts, console applications, and other environments.
The solution to this problem depends on the environment you're working with:
Working with Jupyter Notebooks
If you are working with Jupyter notebooks, simply add %matplotlib inline to the first cell of your notebook to enable the visualization of plots within the notebook itself. For example:
%matplotlib inline
import numpy as np
import matplotlib.pyplot as plt

x = np.linspace(0,10,100)
y = np.sin(x)
plt.plot(x,y)
plt.show()
In this case, %matplotlib inline will instruct Jupyter to display any subsequent plot output within the notebook itself.
Working with Python scripts outside IPython
If you are working outside IPython environment such as with regular Python scripts, comment out or remove the %matplotlib inline line, and replace it with plt.show() which will display the plot in a separate window. For example:
# import necessary libraries
import matplotlib.pyplot as plt
import numpy as np

# generate some data
x = np.linspace(0,10,100)
y = np.sin(x)

# plot the data and display it in a separate window
plt.plot(x,y)
plt.show()
In this case, plt.show() will open a separate window and display the plot output.
Streamline Your Visualizations with PyGWalker
If you're searching for an alternative to dealing with syntax errors and the sometimes complex syntax of matplotlib, PyGWalker could be your answer.
PyGWalker: An Intuitive Data Visualization Tool
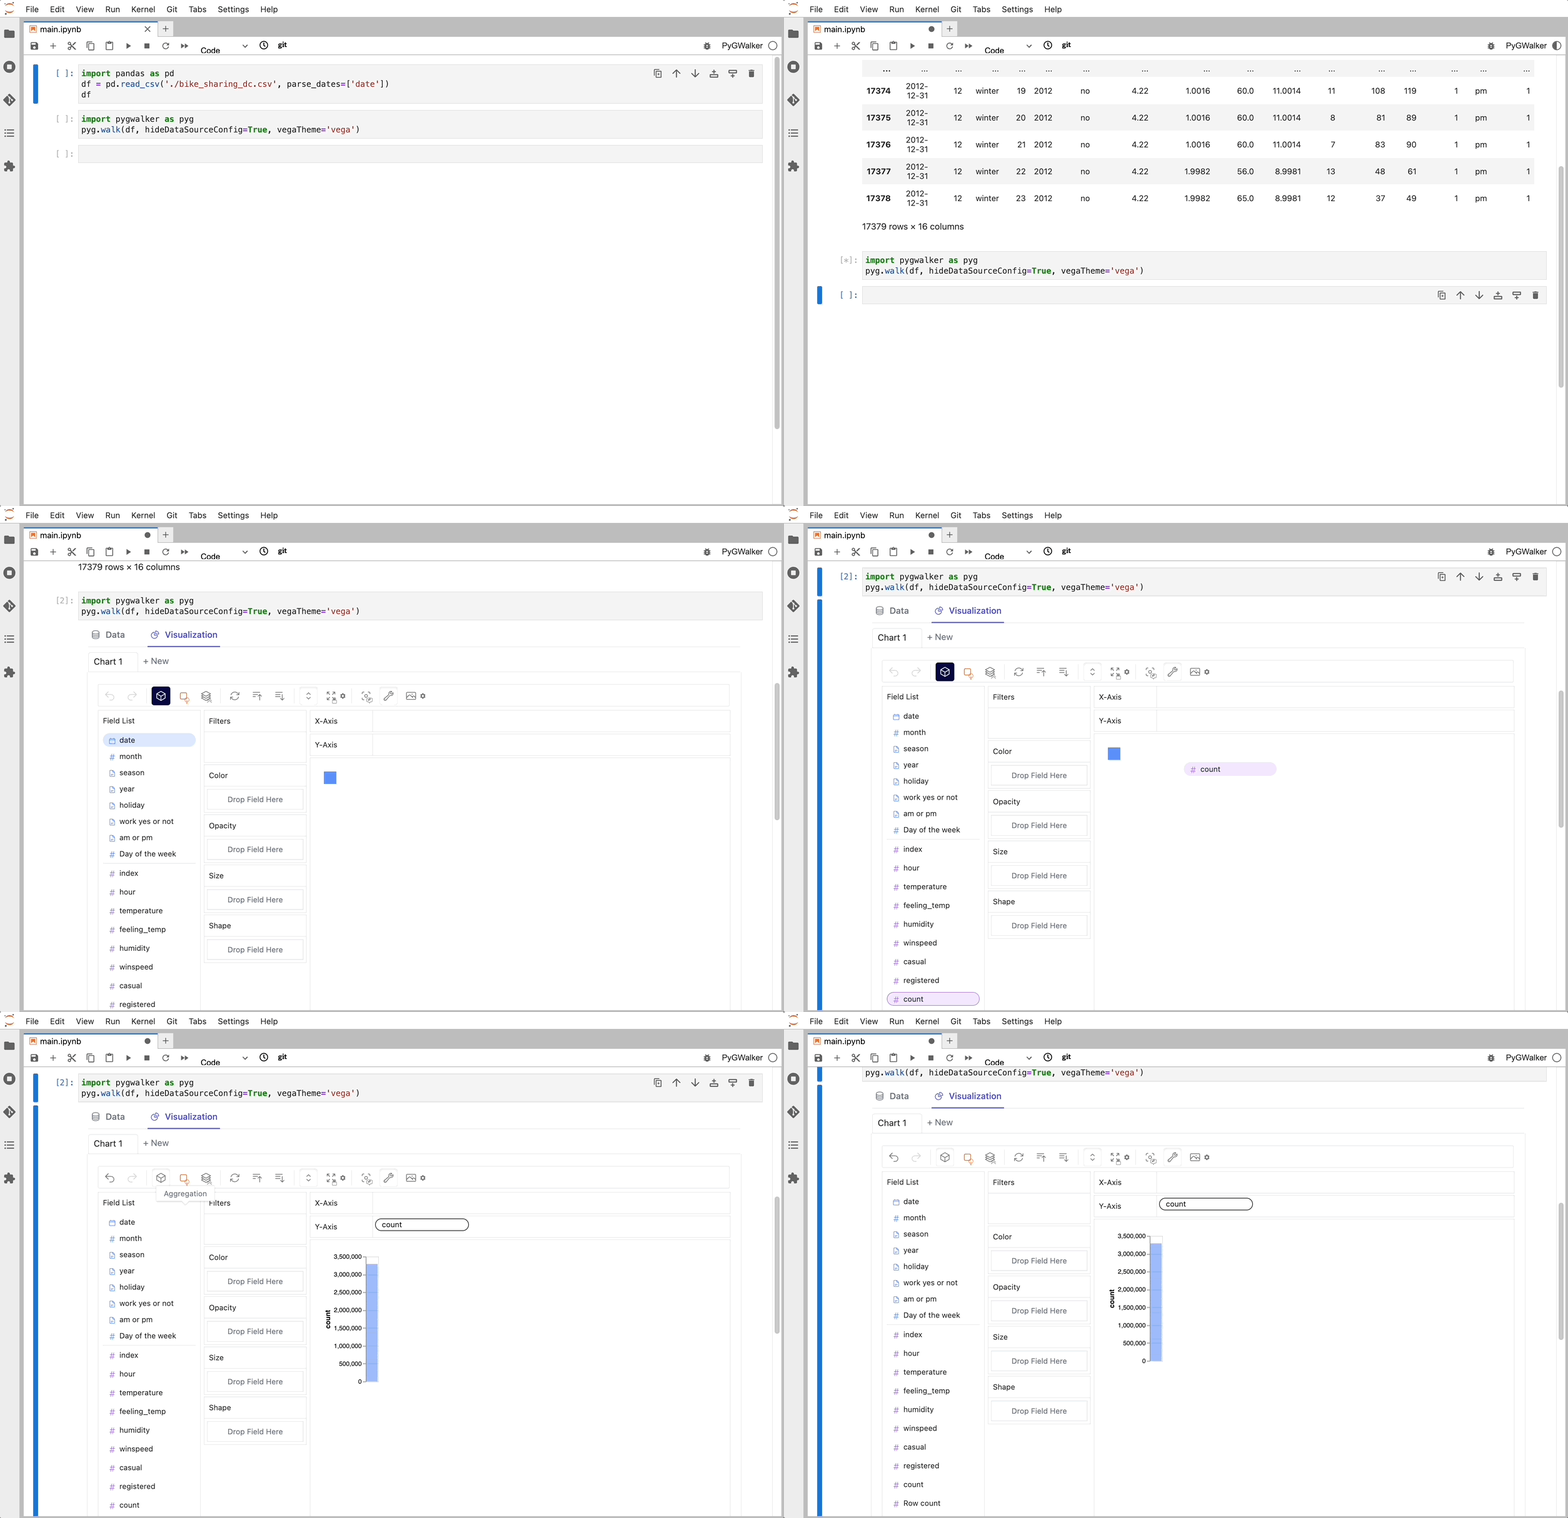
[PyGWalker](GitHub - Kanaries/pygwalker: PyGWalker: Turn your pandas dataframe into a tableau-alternative User Interfa) is an open-source Python project that can speed up your data analysis and visualization workflow. Designed for Jupyter Notebook environments, it turns your Pandas or Polars Dataframe into a visual UI. With simple drag-and-drop actions, you can easily create insightful graphs.
To install and use PyGWalker, use the following commands:
pip install pygwalker
import pygwalker as pyg
gwalker = pyg.walk(df)
That's it. Now you have a tableau-alternative user interface to analyze and visualize data by dragging and dropping variables.

You can also run PyGWalker online using these notebooks:
- Run PyGWalker in Kaggle Notebook (opens in a new tab)
- Run PyGWalker in Google Colab (opens in a new tab)
Also, don't forget to Check Out PyGWalker GitHub and give us a star! https://github.com/Kanaries/pygwalker (opens in a new tab)
If you have any question or suggestion, please open an issue on PyGWalker GitHub (opens in a new tab) as well!
Wrapping Up
Understanding and resolving matplotlib syntax errors is an important skill for anyone working with data visualizations in Python. However, alternative tools like PyGWalker can make the process even simpler, thereby increasing your productivity and enabling you to focus more on analyzing your data. We hope this article was helpful in your journey towards becoming a more proficient data visualization artist.