How to Use Pandas Mean Function
Updated on
Pandas, a critical library in Python, equips data scientists with potent tools to manipulate data. One such tool, frequently used, is the Pandas Mean function. By definition, the Mean function computes the average of the numbers in a given dataset, but its applications in data analysis run much deeper.
Want to quickly create Data Visualizations in Python?
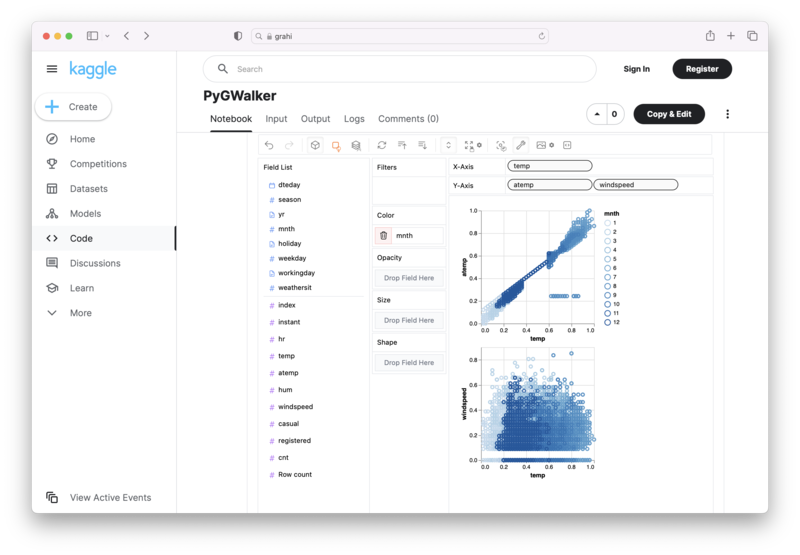
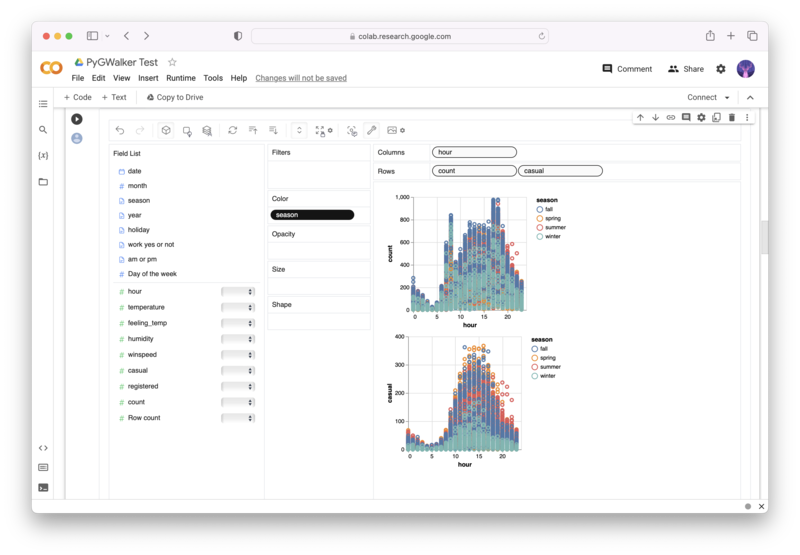
PyGWalker is an Open Source Python Project that can help speed up the data analysis and visualization workflow directly within a Jupyter Notebook-based environments.
PyGWalker (opens in a new tab) turns your Pandas Dataframe (or Polars Dataframe) into a visual UI where you can drag and drop variables to create graphs with ease. Simply use the following code:
pip install pygwalker
import pygwalker as pyg
gwalker = pyg.walk(df)
You can run PyGWalker right now with these online notebooks:
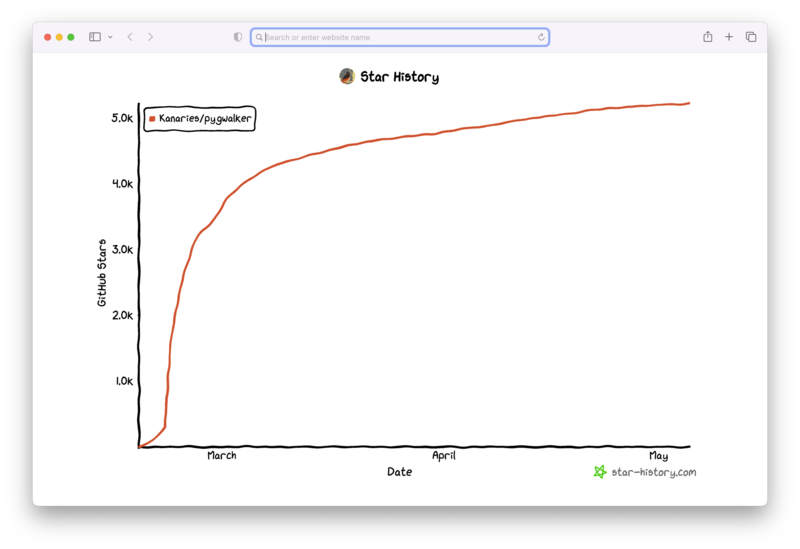
And, don't forget to give us a ⭐️ on GitHub!
Understanding Pandas Mean
The Pandas Mean function can be applied both on a DataFrame and a Series. When applied to a DataFrame, it returns a series with the mean across a specified axis, and when used on a Series, it produces a scalar value, essentially a single number.
Basic Syntax:
pandas.DataFrame.mean()
pandas.Series.mean()
Understanding mean, median, and mode is essential in any data field. The choice of axis (rows or columns) for the average computation underscores its flexibility.
Vital Parameters of Pandas Mean
For the mean function to be correctly used, it's essential to understand its parameters:
-
axis: The axis parameter is a choice between rows (axis='columns' or 1) and columns (axis='index' or 0) for calculating the mean. -
skipna(default is True): This parameter decides whether to include or exclude NA/null values when computing the result. If set to False and an NA is present in the data, the mean function will return "NaN". -
level: This is used when dealing with a multi-index DataFrame. You can pass the name (or int) of the level for the mean computation. -
numeric_only: This parameter is useful when your DataFrame contains mixed data types. It is generally advised to leave this as default to start.
Diving into Examples
Let's take a look at how the Pandas Mean function operates through some examples.
Basic Usage:
import pandas as pd

# Creating a simple dataframe
df = pd.DataFrame({
    'A': [1, 2, 3],
    'B': [4, 5, 6],
    'C': [7, 8, 9]
})

print(df.mean())
In the above example, we are calculating the mean of each column. The output will be a series with the mean of columns A, B, and C.
Using axis parameter:
print(df.mean(axis='columns'))Here, we calculate the mean along the rows. The output will be a series with the mean of each row.
Using skipna parameter:
df = pd.DataFrame({
    'A': [1, 2, 3, None],
    'B': [4, None, 6, 7],
    'C': [7, 8, None, 9]
})

print(df.mean(skipna=False))
In this example, we are including NA values in our computation by setting skipna to False. Because we have NA values in our data, the mean function will return "NaN" for the average.
Conclusion
In conclusion, the Pandas Mean function is a powerful tool for data analysis. It allows flexibility in choosing the axis for computation and handling null values. By understanding its parameters and their usage, one can unleash its full potential. Practice through examples and consistent


